
d3.js csv파일로 table만들기
2021. 3. 30. 00:41ㆍWeb_Programming
데이터 분석 처리 웹사이트 프로젝트에 참여해보면서 데이터 시각화를 위해 d3를 사용해보게 되었어요.
이번 포스팅에서는 csv파일의 내용을 table형식으로 웹에 나타내는 것에 대해 적어보겠습니다 : )
아래 사이트에서 보시면 다양하고 좀 있어보이는(?) 그래프들과 예시 코드들도 있어서 참고해보시면 좋을 것 같아요.
The D3 Graph Gallery – Simple charts made in d3.js
The D3 graph gallery displays hundreds of charts made with D3.js, always providing the reproducible code.
www.d3-graph-gallery.com

위의 csv파일(example.csv)을 가지고 table을 만들어보겠습니다.
작성 코드는 다음과 같습니다.
<main>
<div id="feature_sel"></div>
</main>
<script src="https://d3js.org/d3.v4.js"></script>
<script type="text/javascript">
  d3.csv(filepath+"example.csv", function (data) {
      function tabulate(data, columns) {
          var table = d3.select("#feature_sel")
          //.style("padding","0 0 2% 0")
          //.style("background-color","white")
              , columnNames = columns
              , thead = table.append("thead")
              , tbody = table.append("tbody");


          // append the header row
          thead.append("tr")
              .selectAll("th")
              .data(columnNames)
              .enter()
              .append("th")
              //.style("vertical-align", "middle")
              .text(function (columnNames) {return columnNames; });


          //thead.selectAll("tr")
              //.style("color", "white")
              //.style("font-size", "medium")
              //.style("height", "40px")
              //.style("background-color","#205492")
              //.style("font-weight", "600");

          // create a row for each object in the data
          var rows = tbody.selectAll("tr")
              .data(data)
              .enter()
              .append("tr");

          // create a cell in each row for each column
          var cells = rows.selectAll("td")
              .data(function (row) {
                  return columns.map(function (column) {
                      return { column: column, value: row[column] };
                  });
              })
              .enter()
              .append("td")
              //.style("background-color","#ffffff")
              //.style("font-size", "1.8vh")
              //.style("color", "#09284d")
              //.style("font-weight", "bold")
              //.style("padding", "15px")
              //.style("width","600px")
              //.style("text-align","center")
              .html(function (d) {return d.value; });

          return table;
      };

      tabulate(data, ["th1", "th2", "th3", "th4"])//The names of the columns in the CSV file


  });
</script>
먼저 main이나 body의 표를 넣고싶은 부분에 div를 삽입하고 id를 지정해줍니다.
d3.csv로 파일을 읽어주고 table을 생성하는 함수를 만들어줍니다. (tubulate)
인자로는 input data와 테이블 헤드(th) 리스트를 받습니다.
함수 내에서는 table, columnNames, thead, tbody를 선언하여 각 속성을 처리해줍니다.
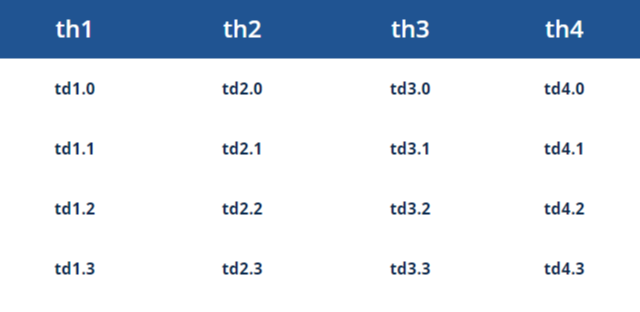
해당 코드로 보면 아래와 같은 테이블을 만들 수 있습니다 :-ㅇ
반응형
'Web_Programming' 카테고리의 다른 글
| [우아한 테크러닝 4기] redux 구현해보기 (0) | 2021.07.02 |
|---|---|
| [자바스크립트] 클로저 (Closure) 함수&커링 (0) | 2021.06.28 |